Introduction
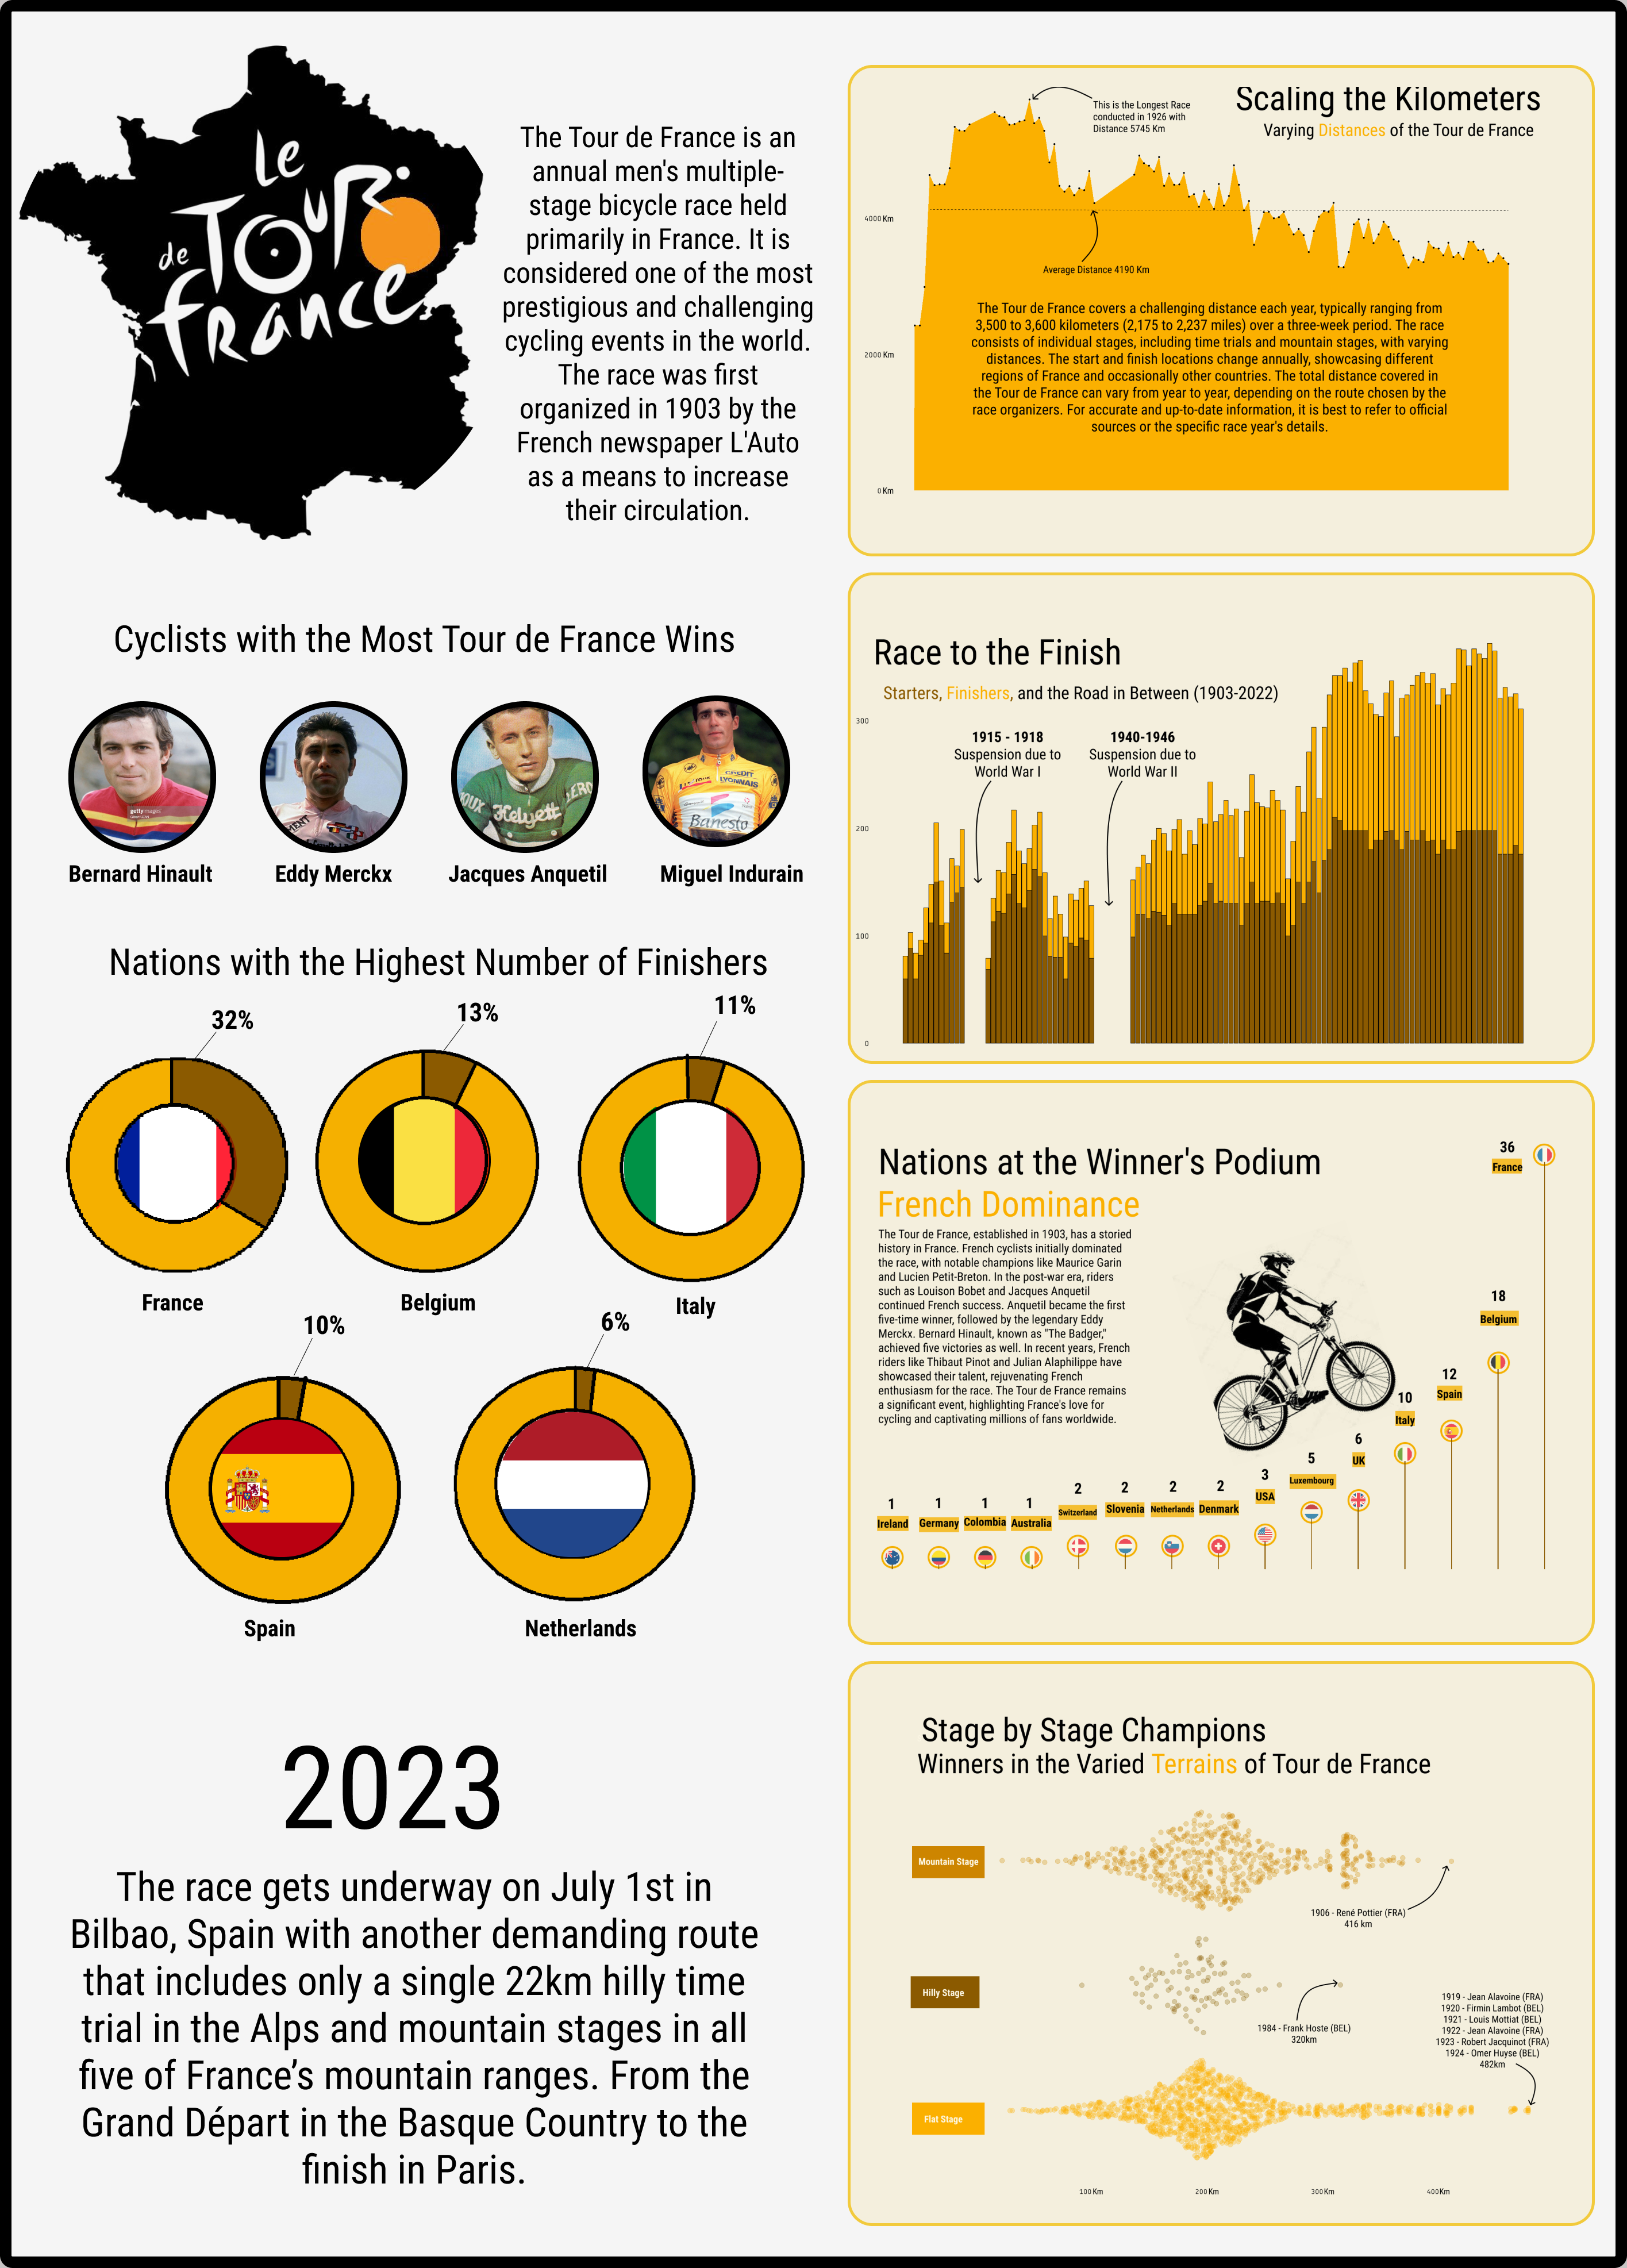
The Tour de France is an annual men’s multiple-stage bicycle race held primarily in France. It is considered one of the most prestigious and challenging cycling events in the world. The race was first organized in 1903 by the French newspaper L’Auto as a means to increase their circulation.
Here are some key details about the Tour de France:
1. Format: The Tour de France is a three-week-long race that typically takes place in July. The race consists of 21 stages, including flat stages, mountain stages, time trials, and a few rest days. The route changes each year, but it always finishes in Paris on the famous Champs-Élysées.
2. Teams: The race is contested by professional cycling teams, known as UCI WorldTeams, which are comprised of eight riders each. There are typically 22 teams participating in the race.
3. Yellow Jersey: The most coveted jersey in the Tour de France is the yellow jersey, also known as the maillot jaune. It is worn by the rider with the lowest cumulative time over the stages. The overall leader at the end of each stage gets to wear the yellow jersey in the subsequent stage.
4. Other Jerseys: In addition to the yellow jersey, there are several other jerseys awarded during the race. These include the polka dot jersey (maillot à pois rouges) for the best climber, the green jersey (maillot vert) for the best sprinter, and the white jersey (maillot blanc) for the best young rider.
5. History: The Tour de France has a rich history and has seen many legendary riders. Eddy Merckx of Belgium and Bernard Hinault of France have both won the race a record five times. Other notable winners include Jacques Anquetil, Miguel Indurain, Lance Armstrong, and Chris Froome.
6. International Appeal: While the Tour de France is primarily held in France, it often passes through neighboring countries and occasionally starts outside of France. The race has gained international appeal, attracting millions of spectators along the route and millions more viewers on television.
7. Cultural Impact: The Tour de France has become deeply ingrained in French culture and has a significant economic impact on the regions it visits. It is a celebrated event that draws passionate fans from around the world.
Let’s dive into some data. You can get the dataset here: Maven Tour de France Challenge
1. Number of starters and finishers each year
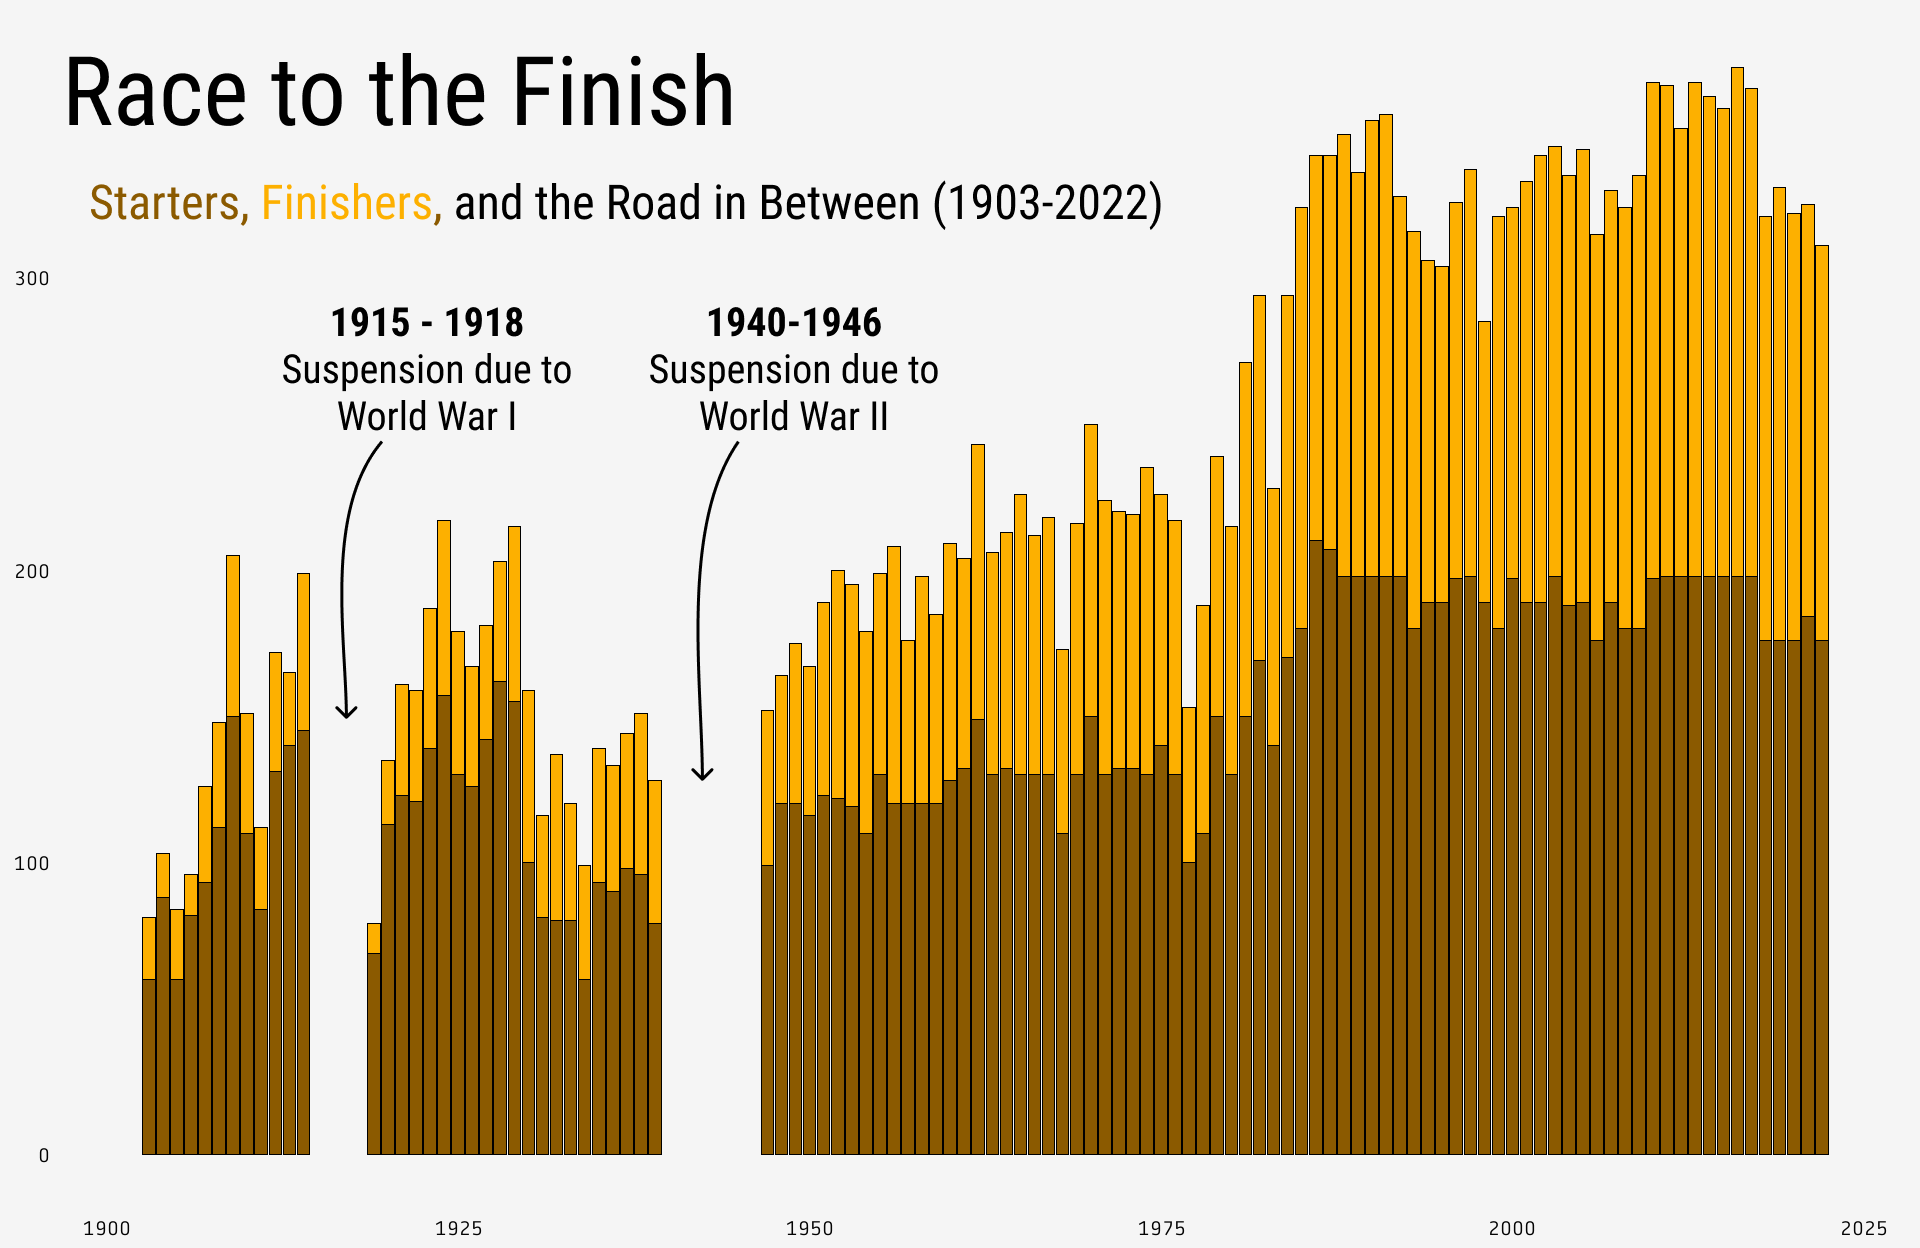
The chart illustrates the disparity between the number of starters and finishers in the Tour de France race from 1903 to 2022. It showcases the consistent trend of having more participants start the race compared to those who successfully complete it. This stark contrast between starters and finishers emphasizes the grueling nature of the event and the immense challenges faced by cyclists along the demanding course. Also the the race was suspended during the years of World War I and World War II.
2. Distance Covered each year
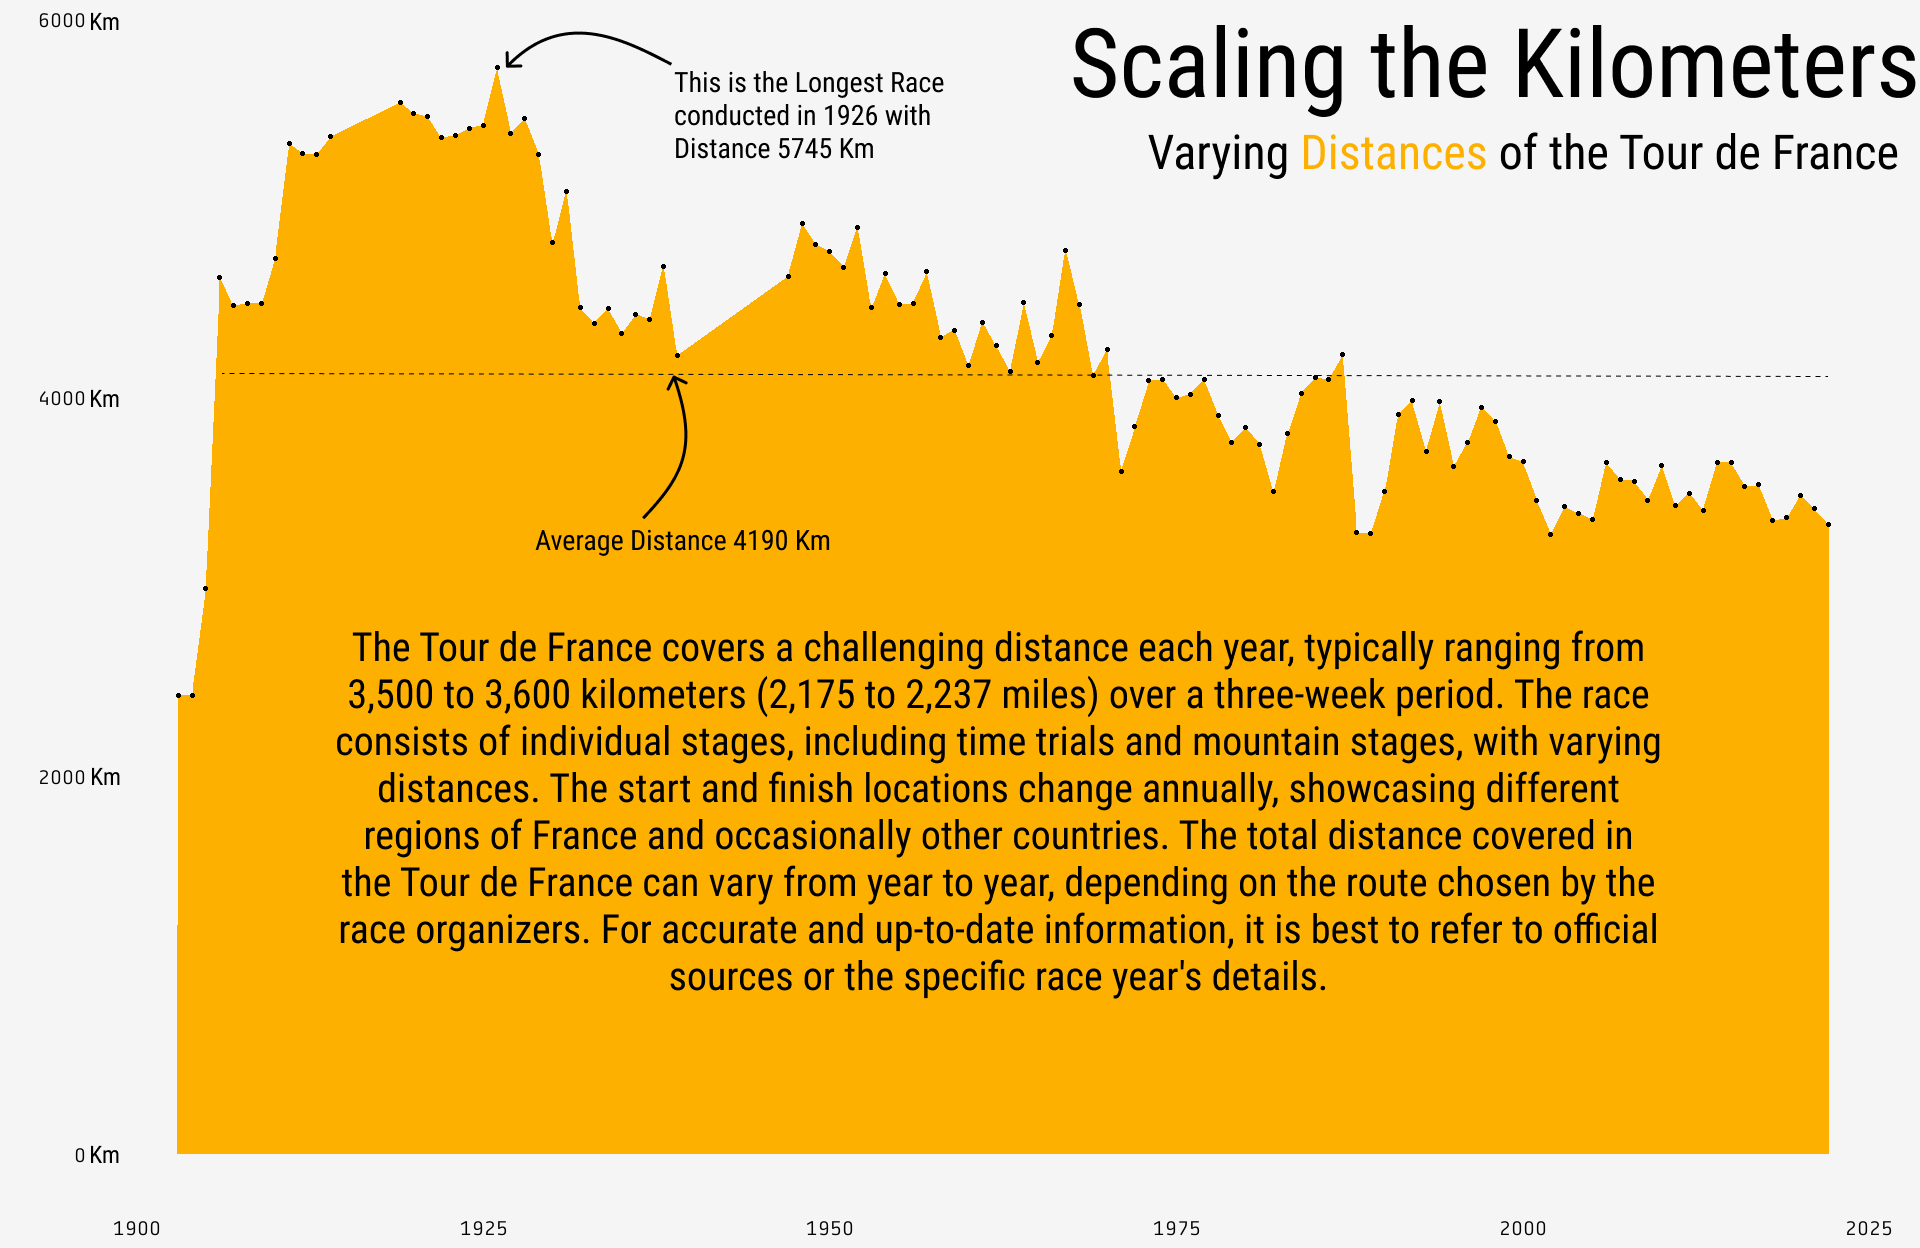
The chart presents the distance covered each year in the Tour de France from past editions up to the most recent data. It reveals a noticeable decreasing trend in the distance traveled over time. This trend signifies a deliberate shift in the race’s format, reflecting changes in race strategies and considerations for the physical well-being of the cyclists.
3. Winners by Stages
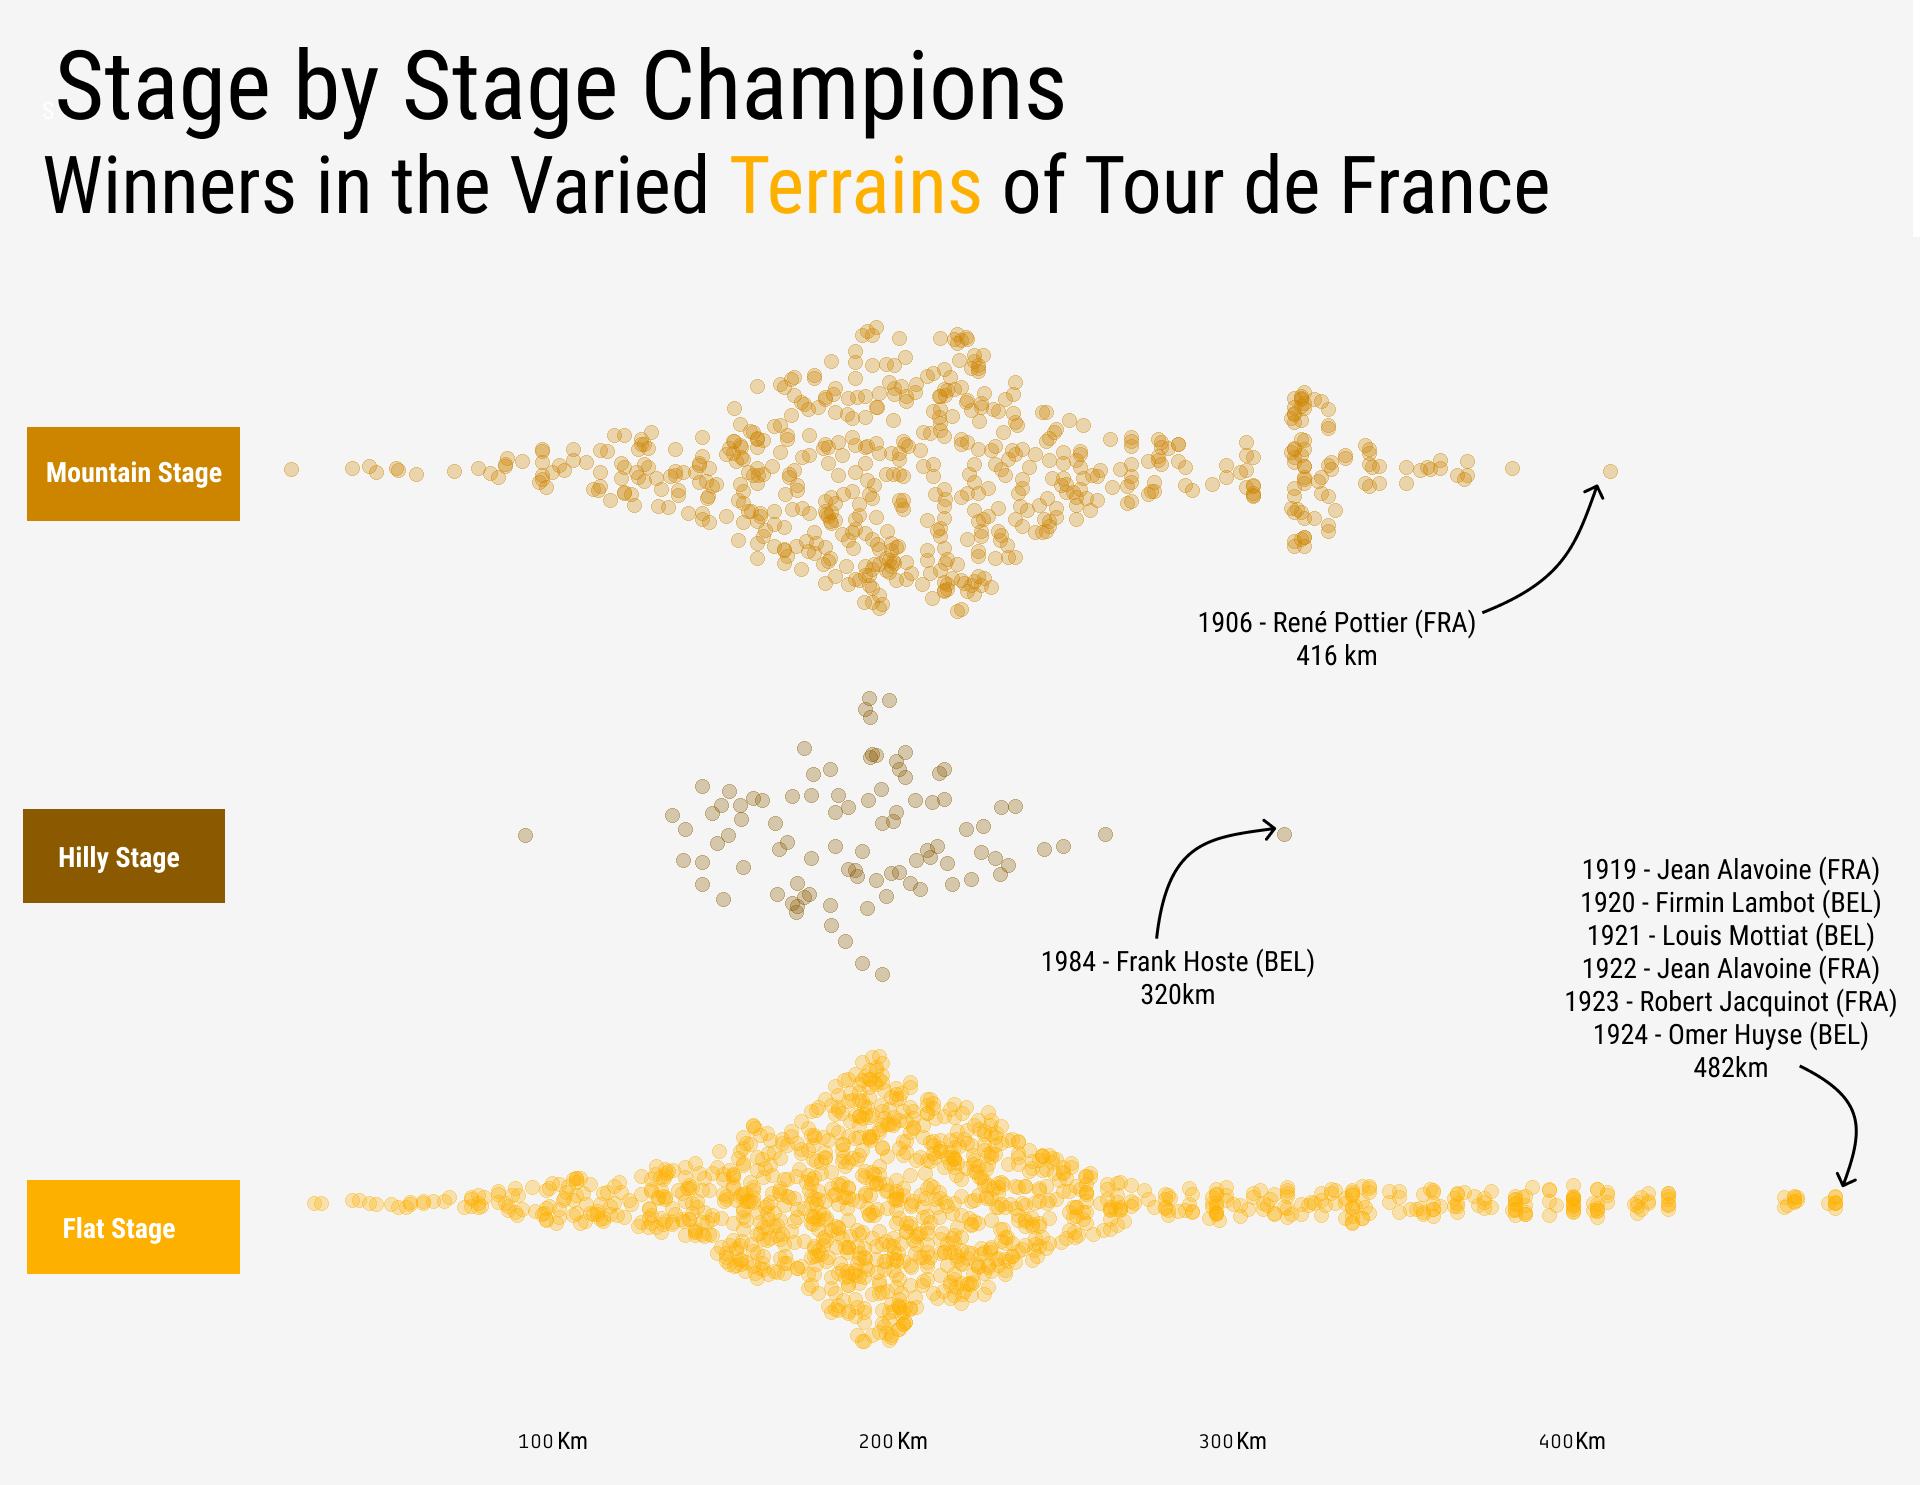
The Tour de France typically consists of 21 stages. However, it’s important to note that the exact number of stages can vary from year to year as the organizers of the race occasionally make changes to the route. Each stage presents a different terrain and challenge for the riders, including flat stages, mountain stages, individual time trials, and team time trials. These stages are spread over a period of three weeks, with rest days interspersed between some of the stages to allow the riders some recovery time.
I have highlighted the 3 main stages in the race i.e., Flat, Mountain and Hilly.
4. Winners by Country
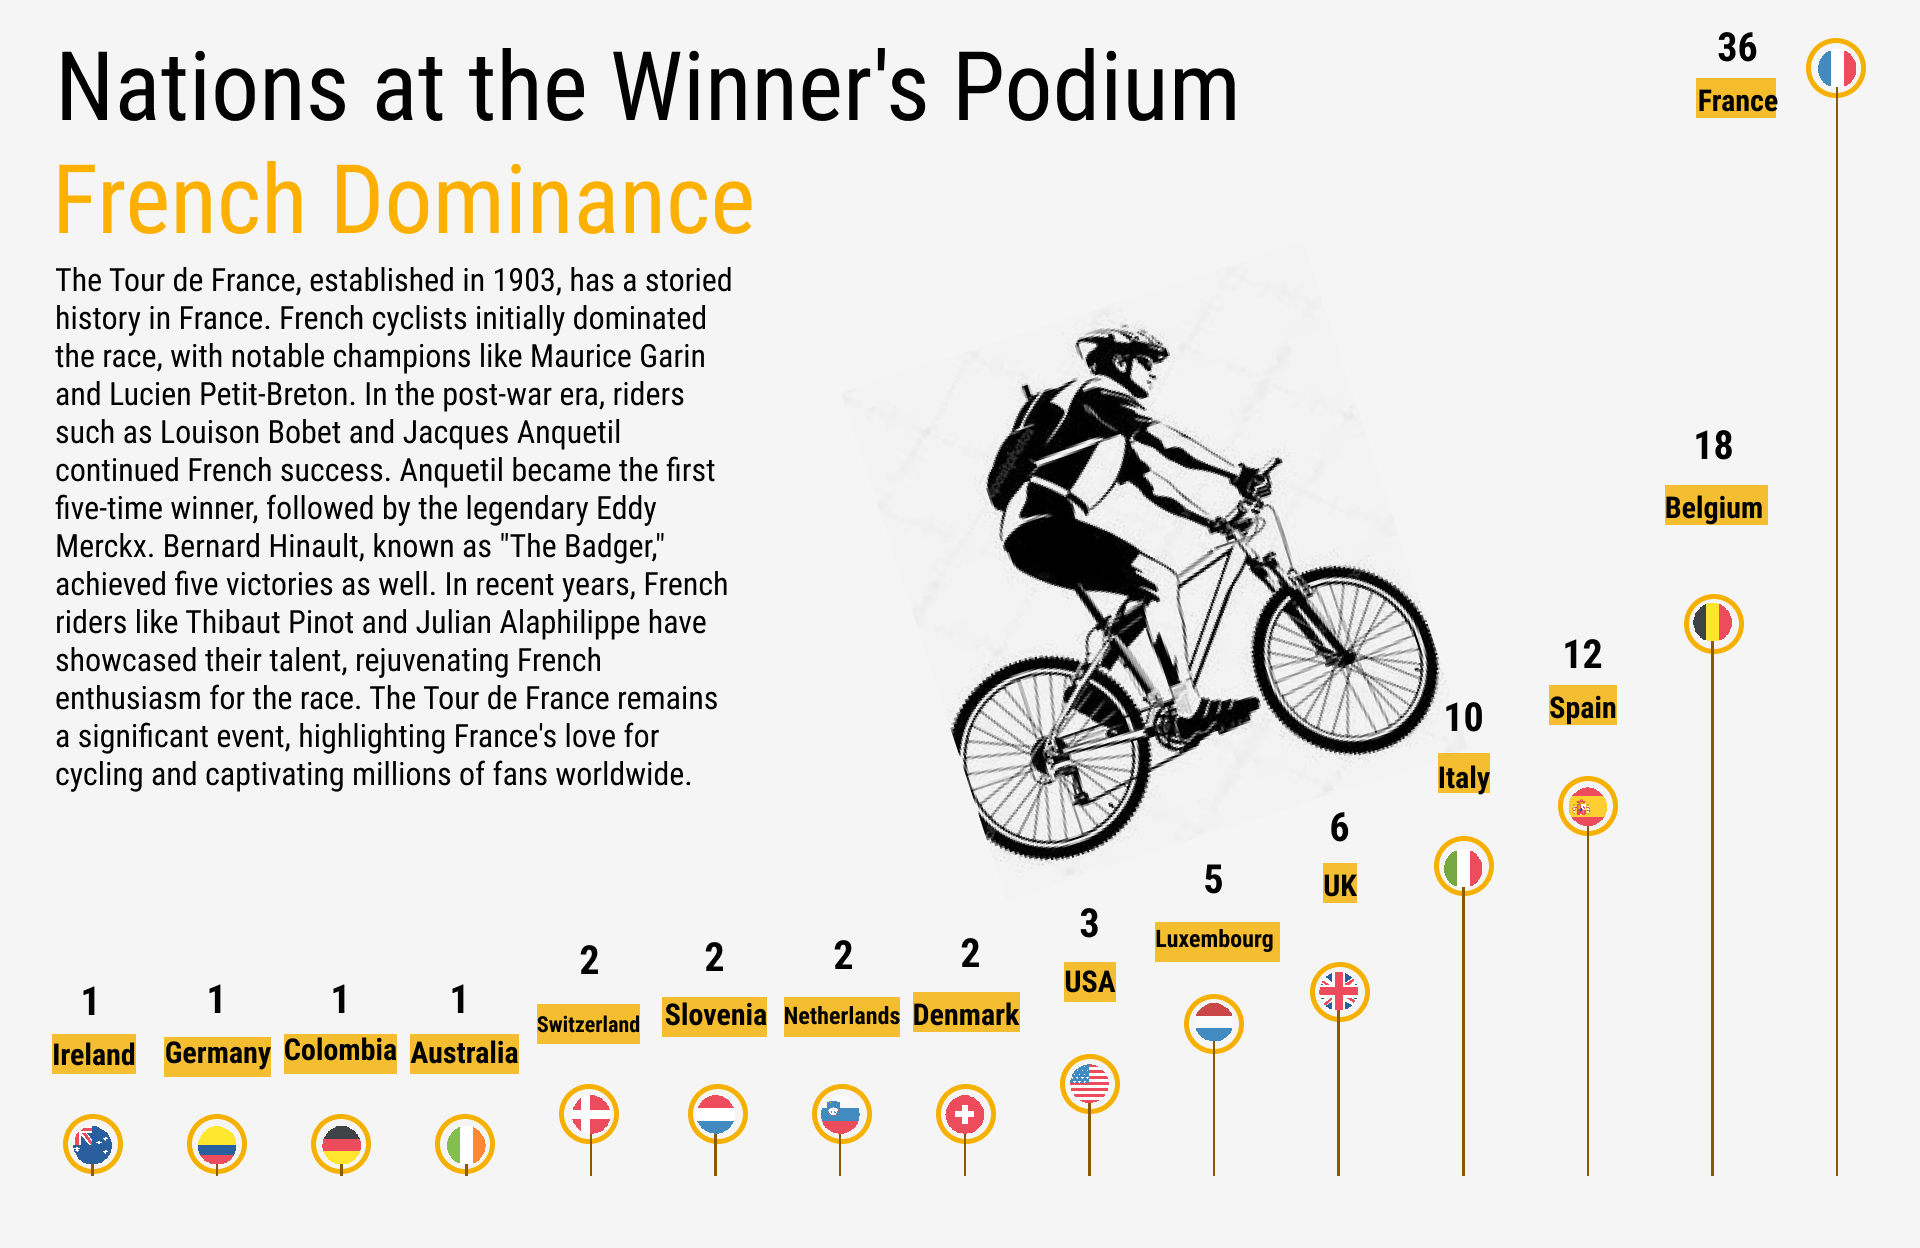
We can see that France has highest number of titles 36 followed by Belgium 18 and Spain 12. We can clearly see the French Dominance.
The Infographic
This infographic and the charts are created using R and Figma. You can see all the images and code here: Code and Images.